
Effective social impact is inherently local
MAPS
MAPS
Community Led Social Impact is fostered on a local level, leveraging the direct input, lived experience, and expertise of the local community to deliver equitable outcomes.
Maps offer a visual and spatial tool in which to overlay the historical, political, environmental, and social determinants of current economic and environmental inequities.
With maps we are able to see the intersectional realities and opportunities for local climate action.

Energy Equity for Renters Policy Tracker
The Energy Equity for Renters Policy Tracker lists which cities, counties, and states have adopted policies and programs to advance both energy efficiency and equity in rental housing as of October 2022. The map captures the following policies:
Adopting a renter right of first refusal on property sale
Creating a rental energy disclosure policy
Promoting existing state and utility efficiency programs to renters and landlords
Adopting a rental energy performance standard and assisting affordable housing providers with compliance
Designing rental efficiency loan and grant programs with affordability covenants
Granting renters the right to make efficiency improvements
Instituting limited-scope rental property retrofit requirements

HOLC Historic Lending Guideline Maps
The Mapping Inequality dataset on PolicyMap comprises of neighborhood risk assessment data for 148 cities across the US. The Federal Home Loan Bank Board (FHLBB), the HOLC’s parent organization, commissioned the City Survey Program in 1935 to collect data on real estate risk levels across 239 cities. As part of the exercise, each neighborhood was evaluated via a network of realtors, lenders, developers, and HOLC staff members, and ultimately assigned a rating or letter grade which signified the neighborhood’s investment prospects for lending. The rating was primarily a function of neighborhood racial and ethnic makeup, housing conditions, and access to public facilities, among other factors.
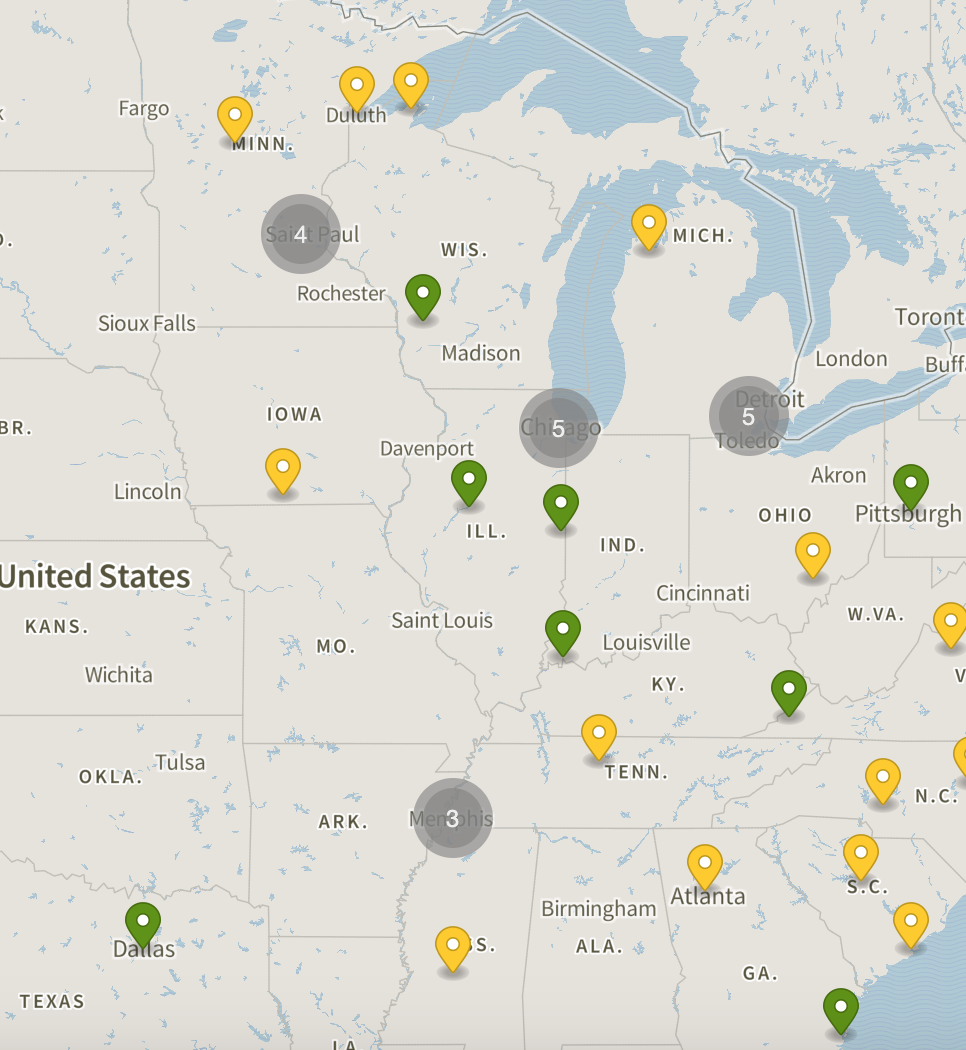
Solar in Your Community Challenge Team Map
The SunShot Prize: Solar in Your Community Challenge is a prize competition that aims to expand solar electricity access to all Americans, especially underserved segments such as low- and moderate-income (LMI) households, state, local, and tribal governments, and nonprofit organizations. In order to make solar more accessible and inclusive for every American, the challenge works to spur the development of new and innovative financial and business models that serve non-rooftop solar users such as community solar.

Materiality Map
SASB Standards guide the disclosure of financially material sustainability information by companies to their investors. Available for 77 industries, the Standards identify the subset of environmental, social, and governance issues most relevant to financial performance in each industry.

Novogradac Opportunity Zones Mapping Tool
Designated opportunity zones displayed in the Novogradac Opportunity Zones Mapping tool are those that were nominated by those chief executive officers, and have been certified and designated by the Treasury Department. In addition, every low-income census tract in Puerto Rico was designated as an OZ in 2018 budget legislation. Once an OZ is designated, it remains a qualified OZ for a period of 10 years from the date of designation.
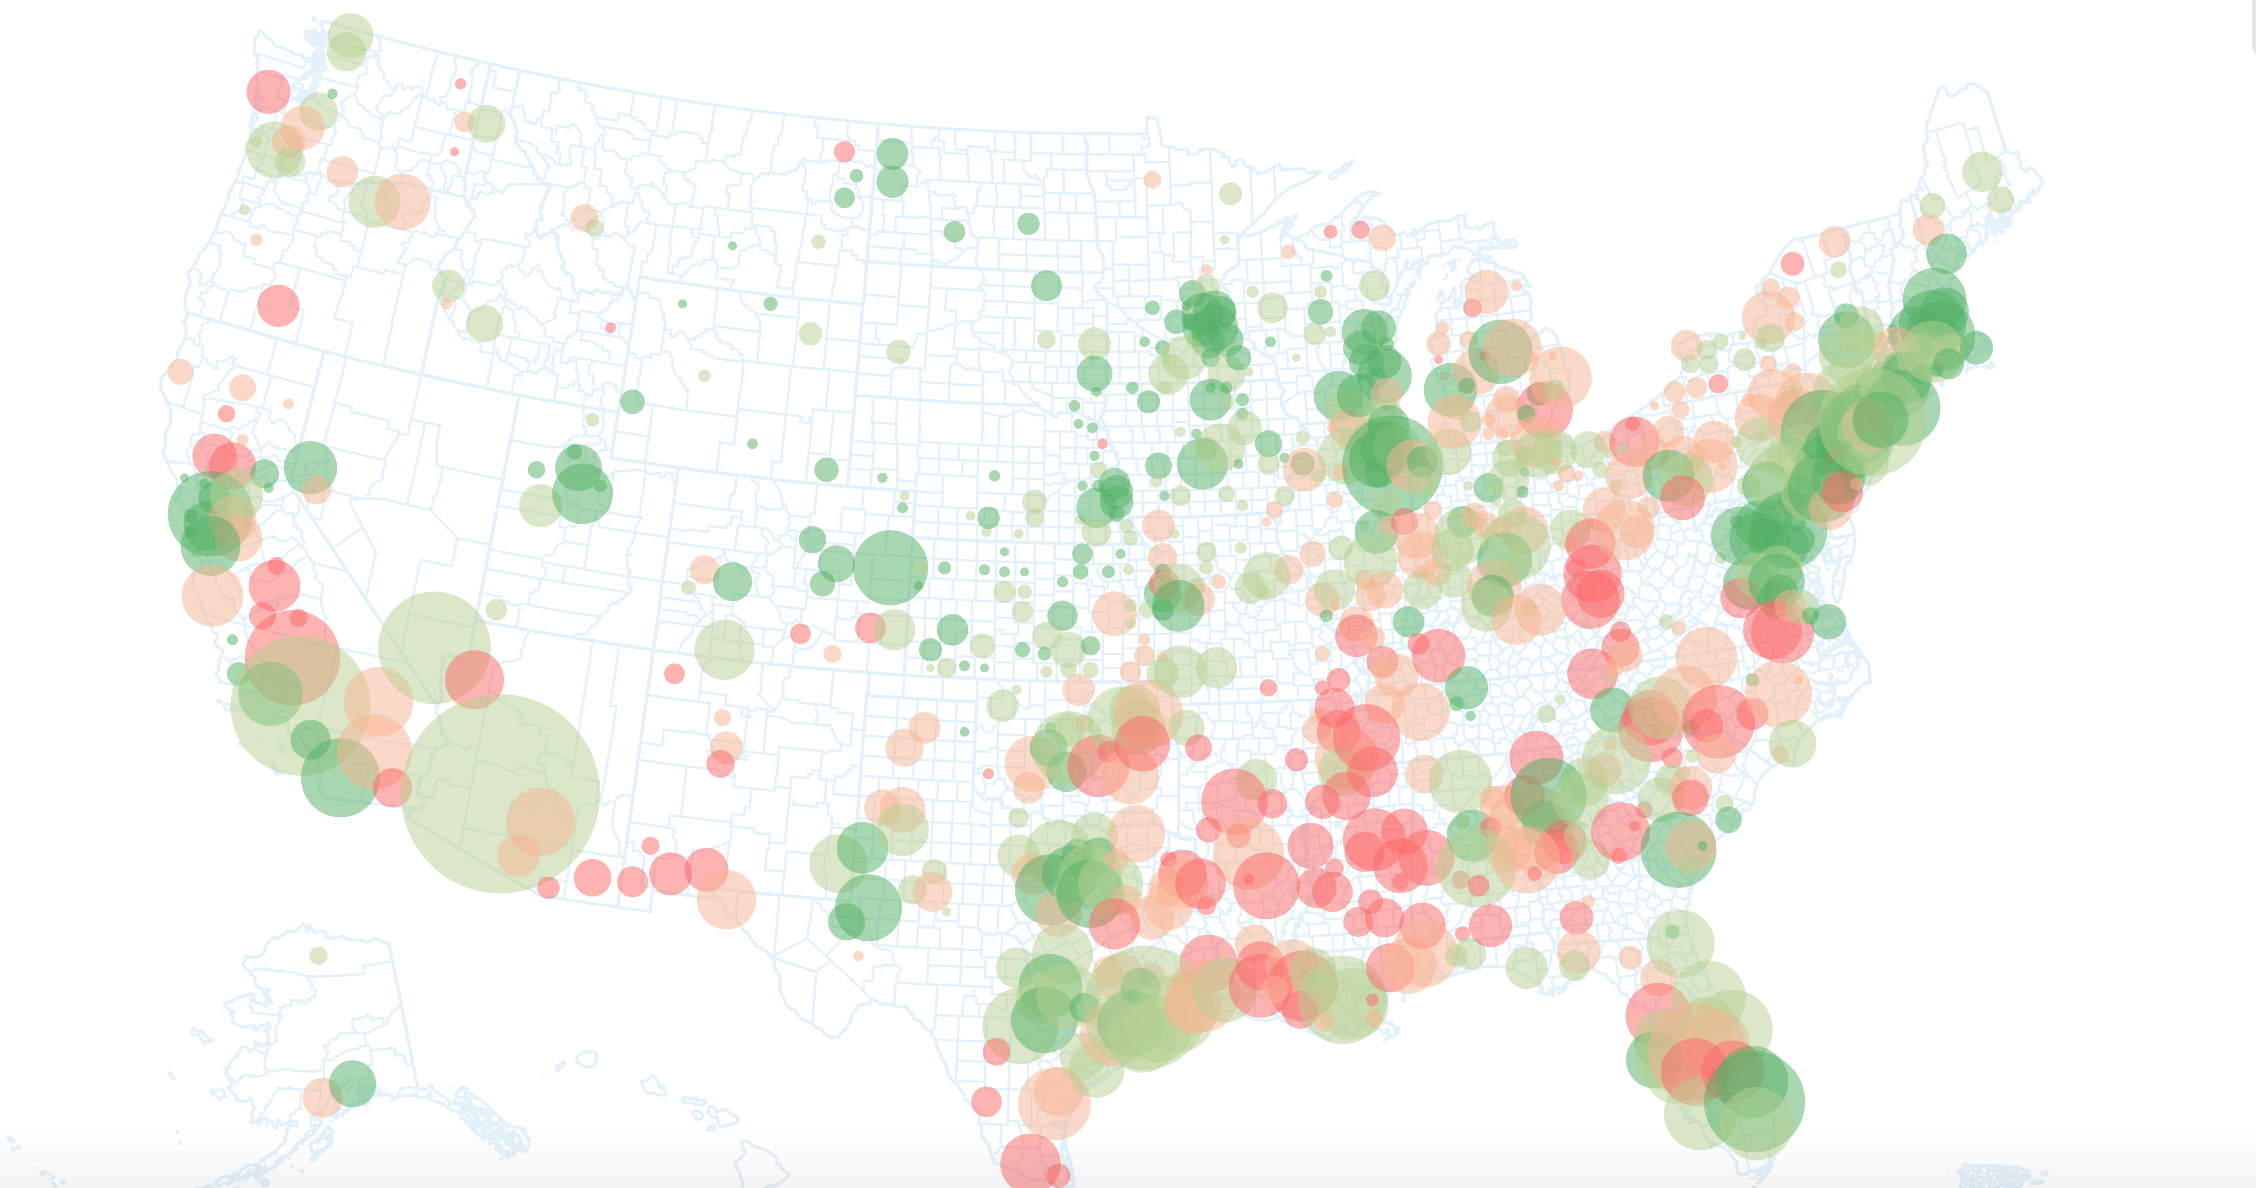
Mapping U.S. Energy Communities
Exploring which US counties are potentially vulnerable to a transition away from fossil fuels.

Sundown Town Map
Sundown towns, also known as sunset towns, gray towns, or sundowner towns, are all-white municipalities or neighborhoods in the United States that practice a form of racial segregation by excluding non-whites via some combination of discriminatory local laws, intimidation or violence. The term came from signs posted that "colored people" had to leave town by sundown.

Rural City Map
The Infrastructure Investment and Jobs Act is the largest investment in climate resilience in U.S. history. The $1.2 trillion in funding will create transformative opportunities for local governments that own and maintain most of the nation’s infrastructure, but first state and federal agencies must ensure the resources get to the places that need it the most. To help identify communities that need support but may lack staff and expertise to compete for federal funding, we have created a first-of-its-kind Rural Capacity Map.

The Social Vulnerability Index (SVI) Interacitve Map
ATSDR is directed by congressional mandate to perform specific functions concerning the effect on public health of hazardous substances in the environment. These functions include public health assessments of waste sites, health consultations concerning specific hazardous substances, health surveillance and registries, response to emergency releases of hazardous substances, applied research in support of public health assessments, information development and dissemination, and education and training concerning hazardous substances.
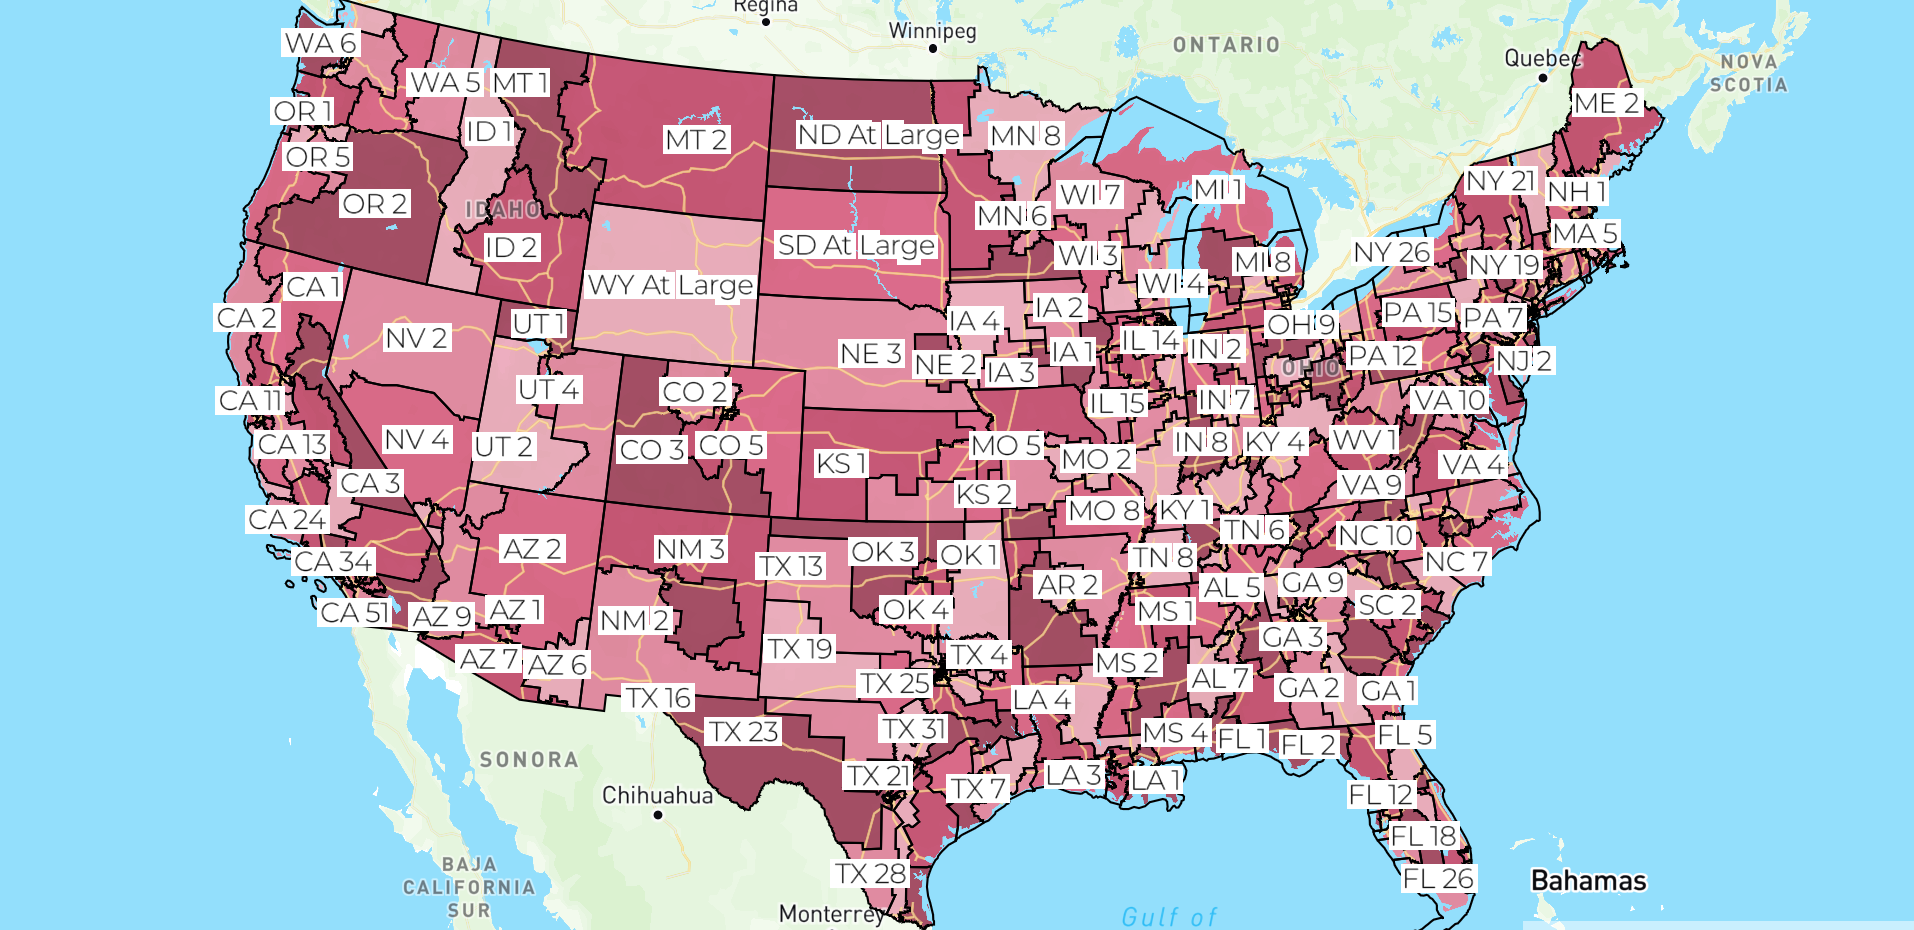
Congressional Districts Map
GovTrack.us’s mission is to help Americans participate in their government. a. We make information about the United States Congress accessible, understandable, and actionable for public use. b. We do this by putting the information in context, tracking new developments on issues our users care about, and helping our users take action to make a meaningful difference. c. We actively seek out any information relevant to our mission and new ways to analyze and explain that information.